PPM (parts per million) measures how concentrated your hydroponic nutrient solution is, and a reliable reading is the fastest way to know whether your plants are being fed, underfed, or burned. If your solution is sitting at 3000 ppm and your lettuce is tipping yellow at the edges, the meter tells you the real story before the plants do. Most growers own a meter; far fewer know what numbers to aim for, when to top off the reservoir, and when to dump it.
PPM is also the cleanest feedback loop you have in a soilless system. Soil buffers everything; a hydroponic reservoir does not. Whatever you add shows up on the meter within minutes, and whatever the plant absorbs shows up within hours. That is why learning to read the meter correctly, and to act on what it says, is the single highest-leverage skill in managing nutrient concentration.
This guide covers what PPM actually means, how to measure it without false readings, the target ranges for seedlings, vegetative growth, and fruiting plants, and how to correct both deficiencies and excesses. By the end, you will be able to take a reading, interpret it against the growth stage you are in, and decide whether to add water, add nutrients, or change the solution entirely.
What PPM Actually Measures in a Hydroponic System
PPM stands for parts per million and counts every dissolved solid in your nutrient solution, including the mineral salts your plants actually feed on (nitrogen, potassium, calcium, magnesium, phosphorus) and any inert contaminants (sodium, chloride from hard water). A reading of 1500 ppm means that in every million parts of solution, 1500 parts are dissolved solids.
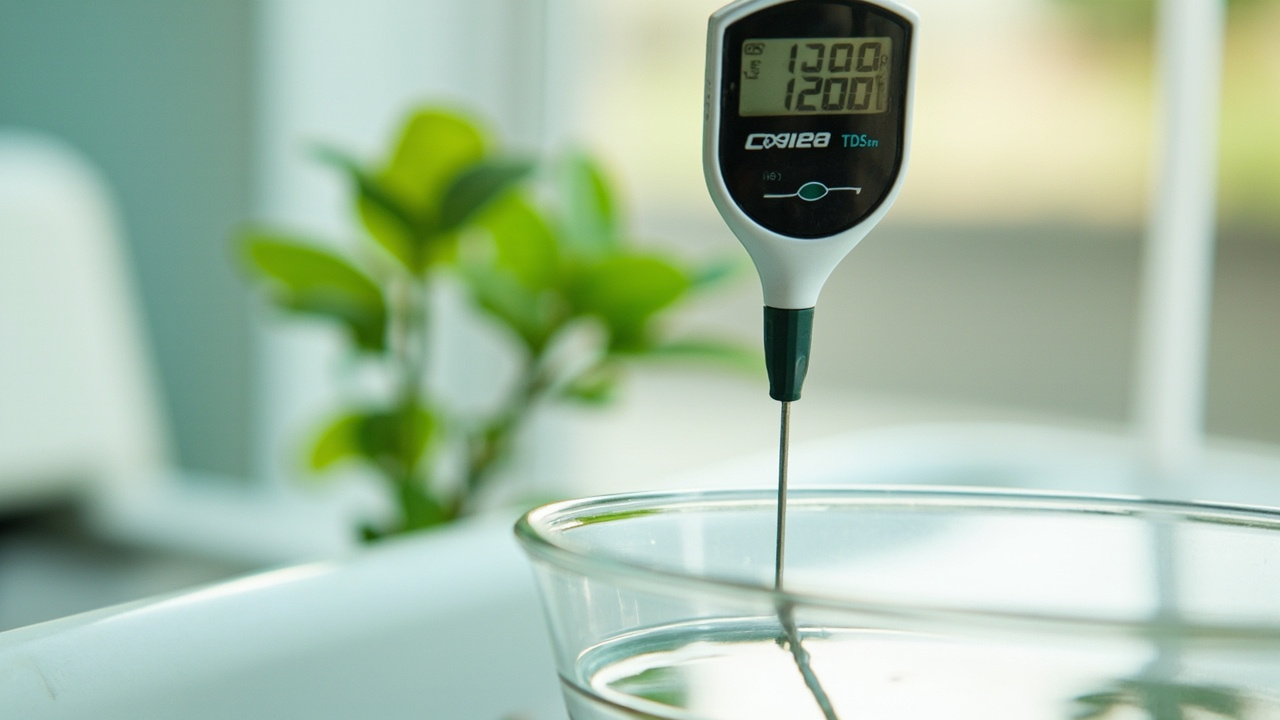
PPM is almost always inferred from EC (electrical conductivity) rather than measured directly. A TDS meter passes a small current through the solution and converts the conductivity reading into a PPM number. Two conversion scales are in common use: the 500 scale (1.0 EC = 500 ppm, used in the United States) and the 700 scale (1.0 EC = 700 ppm, used in the UK, Australia, and most of Europe). If you mix up scales, a 1.4 EC solution reads as 700 ppm on the 500 scale or 980 ppm on the 700 scale, and the difference is large enough to push a borderline reading into toxic territory or out of the target band entirely. Always check which scale your meter uses; it is usually printed on the device or in the manual.
For a deeper look at how EC meters work and what their numbers really mean, our EC meter guide walks through calibration, temperature compensation, and probe care.
How to Take a PPM Reading You Can Trust
A bad reading is worse than no reading, because it sends you off to adjust a solution that was already fine. Three habits separate a reliable number from a guess: temperature, stirring, and probe position.
Step 1: Stir the reservoir gently before sampling. Concentrated solution sits at the bottom and dilute water floats on top in any reservoir that has been sitting still for more than an hour. A reading taken from the top will be 200 to 400 ppm lower than the true average. Either stir briefly or take the sample from a circulation pump output line if your system has one.
Step 2: Let the probe equilibrate. Most pens take 30 to 60 seconds to stabilize, especially in cold reservoirs. A reading that is still drifting is not a reading yet. Hold the probe in the solution until the display locks.
Step 3: Rinse with distilled or RO water and store dry or in probe storage solution between uses. A crust of dried nutrient salts on the probe throws off the next reading, usually on the high side. Calibrate monthly with a known standard (1413 µS/cm calibration solution is the industry default) and replace the probe when calibration drifts more than 10%.
Temperature matters more than most beginners realize. Most meters auto-compensate to 25°C (77°F), but a 10°C swing changes the raw conductivity reading by roughly 2% per degree. A cold reservoir in a basement at 15°C (59°F) will read artificially low unless the meter compensates. The nutrient mixing guide covers the right temperature window for both mixing and reading.
Target PPM Ranges by Growth Stage
The numbers below are starting points for the 500 scale (1.0 EC = 500 ppm), which is what most US growers and most pre-mixed nutrient bottles assume. If your meter uses the 700 scale, multiply each PPM value by 0.71 to get EC, or by 1.4 to convert 500-scale PPM to 700-scale PPM. When in doubt, work in EC, since that is the underlying measurement.
Seedlings and Cuttings (Week 1 to 2)
Target 300 to 500 ppm (0.6 to 1.0 EC). Roots are small, leaf area is tiny, and the plant cannot pull nutrients fast enough to justify a stronger solution. Most nutrient burn in young plants traces back to a reservoir that was mixed at full vegetative strength from day one. A weak feed for the first 10 to 14 days gives roots time to colonize the substrate and ramps uptake capacity before the heavy feed begins.
Vegetative Growth (Week 3 to 6 for most crops)
Target 800 to 1200 ppm (1.6 to 2.4 EC) for leafy greens and herbs. Target 1000 to 1400 ppm (2.0 to 2.8 EC) for fruiting crops during their vegetative phase, before flowering triggers. Nitrogen demand peaks here, and the reservoir will drop 100 to 200 ppm per day in a stocked system as the plants drink. Top up with a half-strength nutrient mix rather than full strength to avoid overshooting the upper bound.
Fruiting and Flowering (Week 6 Onward)
Target 1200 to 1600 ppm (2.4 to 3.2 EC) for tomatoes, peppers, strawberries, and similar fruiting crops during peak fruit set. Potassium and phosphorus demand rises sharply, calcium demand stays steady, and nitrogen should taper slightly to keep the plant from staying too vegetative. Lettuce and other leafy greens should stay in the vegetative range for their entire life cycle; pushing them above 1200 ppm causes tip burn and bitterness.
Reading the Drift: When to Top Up, When to Change the Solution
Reservoir PPM moves in two patterns, and the pattern tells you what to do.
Drift pattern 1: gradual downward drift. The reading drops 100 to 300 ppm per day as plants drink. This is normal. Replenish the reservoir with a half-strength nutrient solution until the volume is back to the target level and the PPM is back in range. Adding full-strength concentrate to a half-empty reservoir is the most common way growers overshoot into nutrient burn, because they compensate for the missing water without accounting for the salts already in solution.
Drift pattern 2: stable reading that suddenly drops fast. The reservoir is at 1100 ppm and falls to 700 ppm overnight. That usually means the solution ran low, roots hit air, or a plant hit a sudden growth spurt and pulled hard. Top up with water first to restore volume, then add nutrients to bring the reading back into range. A sudden drop with no obvious cause is also a hint to check pH, because the pH drift can lock out nutrients and cause plants to stop drinking, which inverts the pattern.
Drift pattern 3: rising reading. The PPM climbs even as water level drops. This is almost always evaporation. Plants take pure water and leave salts behind, so the solution concentrates. Top off with plain pH-adjusted water (no nutrients) until the reading returns to target. If the reading keeps climbing faster than water is evaporating, suspect a stuck float valve, a leaking drain, or a malfunctioning doser.
Change the solution entirely every 7 to 14 days in a recirculating system, even if the PPM is in range. Salt ratios shift over time as plants selectively absorb some ions faster than others, and the meter measures total dissolved solids, not balance. A solution that reads 1100 ppm in week one and 1100 ppm in week three is not the same solution, and deficiencies creep in long before the total number moves.
Correcting Common PPM Problems
PPM Too Low: The Solution Is Too Weak
Symptoms include pale new growth, slow growth, and small leaves, especially in fast-growing crops. Confirm with a meter reading below the target range for the growth stage. Correct by adding nutrients in small doses: 10 to 20% of the manufacturer’s recommended full strength at a time, mixing, waiting five minutes, and re-reading. Most home dosers overshoot because they treat the bottle’s recommended dose as a starting concentration rather than a maximum. Recheck pH after each addition, since adding concentrate can shift pH by 0.3 to 0.5 units.
PPM Too High: Nutrient Burn or Salt Buildup
Symptoms include brown, crispy leaf tips, leaf curl, dark green leaves with a glossy or leathery look, and a general scorched appearance that starts at the edges. Confirm with a meter reading above the target range. Correct by diluting with pH-adjusted water: add 10% of the reservoir volume at a time, stir, wait, re-read, and repeat until the reading lands in range. In severe cases, dump the reservoir entirely and mix fresh. The DIY nutrients guide covers how to mix a fresh batch at the right starting strength.
PPM In Range but Plants Still Struggle
This is the most common hidden problem. The meter only counts total dissolved solids, not which solids are present. A reservoir at 1100 ppm from calcium nitrate alone behaves very differently from a balanced 1100 ppm feed, and a meter cannot tell them apart. When the reading is right and the plants are still off, the next step is pH (most nutrient lockout happens there), then a full solution change to reset salt ratios, then a check of the water source for sodium and chloride if the problem repeats.
Building a Daily PPM Routine
Two readings per day, taken at the same time, on a stirred reservoir, will catch 90% of concentration problems before they show up in the plants. Most growers do best with a morning reading before lights on (or before the daily temperature peak) and an evening reading to track daily drift. Log the number, the volume top-off, and any nutrient additions. After two weeks you will have a clear pattern for each reservoir in your system, and departures from the pattern will stand out immediately.
PPM is not the whole picture; it is the foundation. A balanced nutrient mix at the right concentration and the right pH is what your plants actually need, and PPM is the meter that tells you whether the concentration part is on track. Once you trust the reading, the rest of reservoir management becomes a matter of following the number instead of guessing.