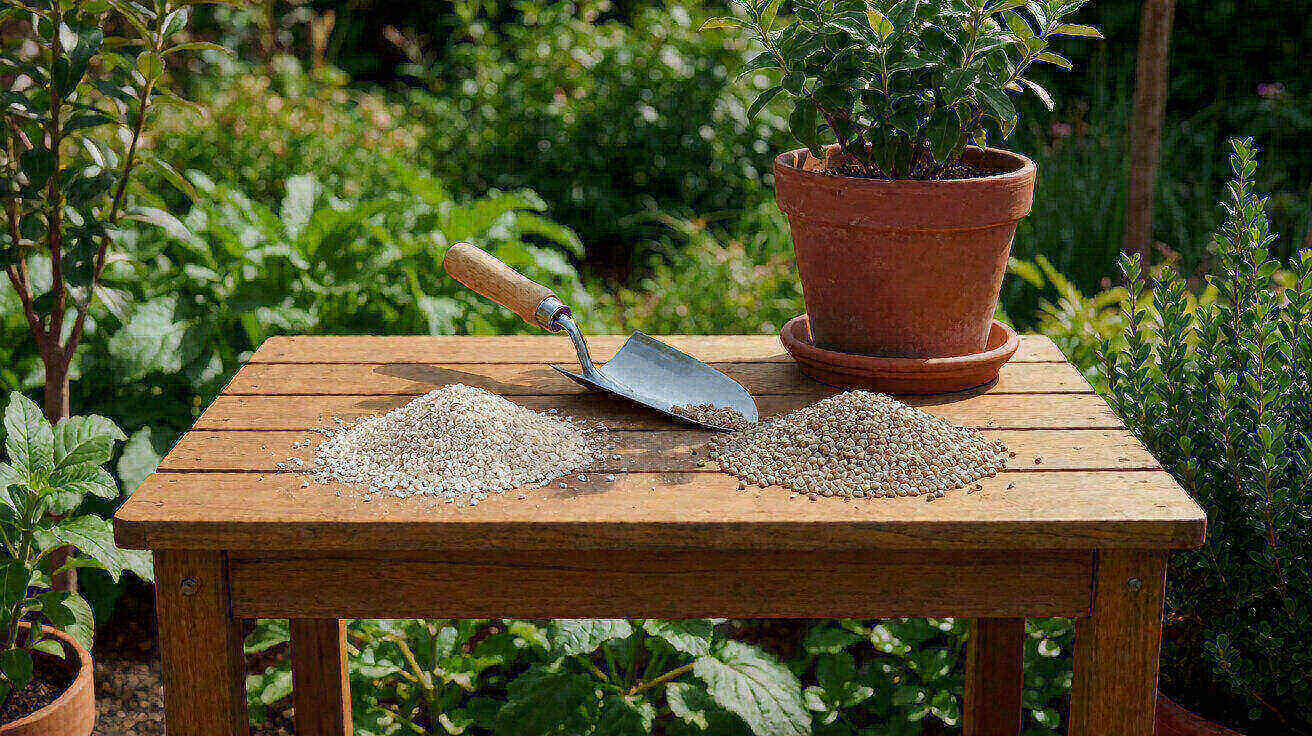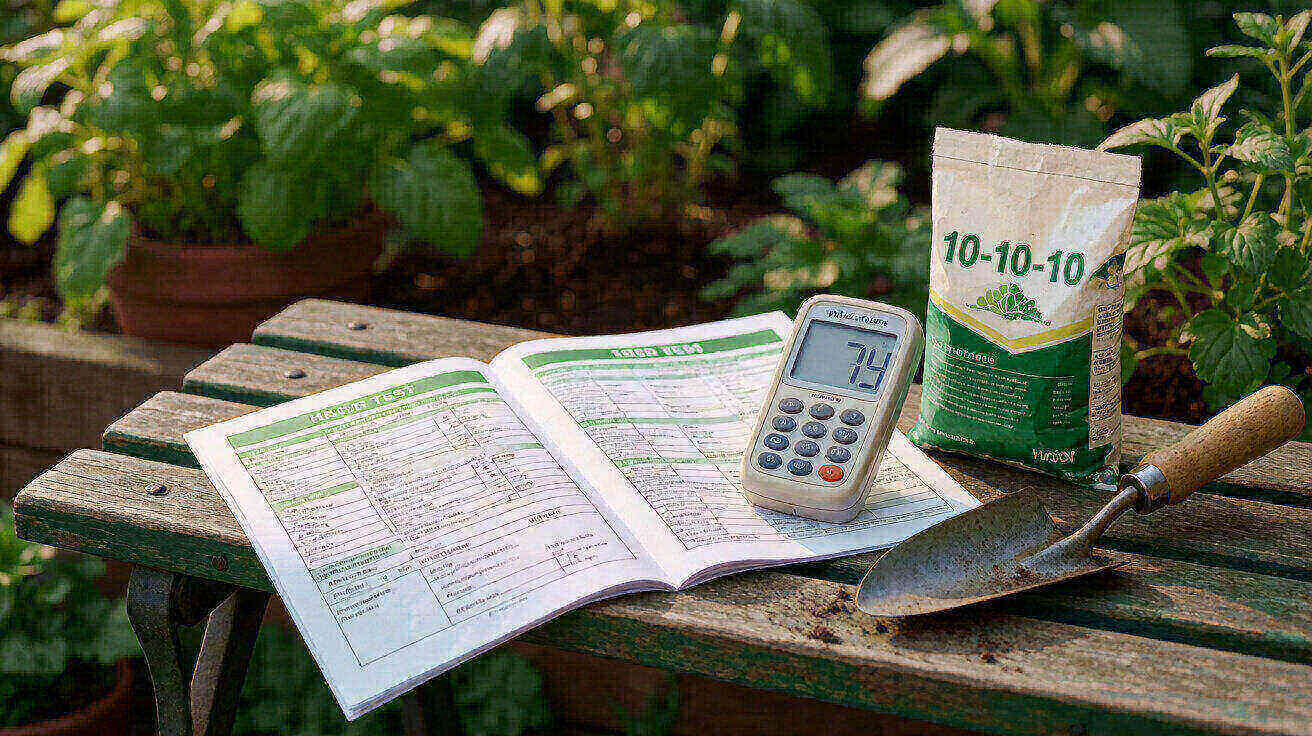

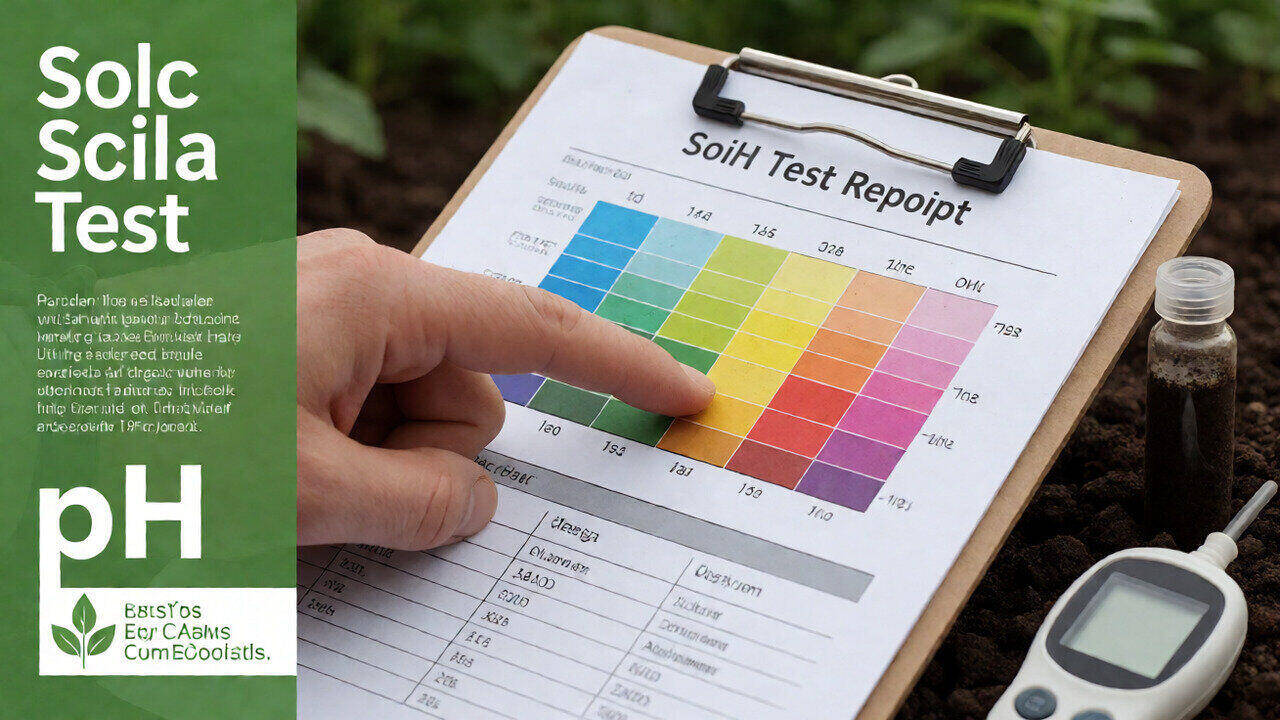
A soil test report arrives as a page or two of numbers, ranges, and recommendation lines. Most gardeners read the pH, glance at the rest, and file it. That is the expensive mistake. The report already tells you what to buy, what to skip, and how much. This guide walks a representative report line by line, shows the math to convert ppm to pounds per 1,000 square feet, and ends with one decision rule you can apply in the store aisle.
What a standard soil test report actually contains
Most university labs use a similar layout, so once you learn one, you can read any of them. Expect these sections:
- Sample information: lab number, date, crop or plant type you listed, and the depth sampled.
- pH and buffer pH: acidity and the lime requirement needed to raise it.
- Organic matter: percent by weight, a proxy for soil biology and nutrient holding capacity.
- CEC (cation exchange capacity): how much nutrient the soil can hold and supply over time, in meq/100g.
- Nutrient panel: phosphorus (P), potassium (K), calcium (Ca), magnesium (Mg), sulfur (S), and often micronutrients (Fe, Mn, Zn, Cu, B).
- Sufficiency ratings: Low, Medium, High, or Very High for each nutrient.
- Recommendation line: N, P2O5, and K2O rates for your stated crop.
Two things matter most on that page: the sufficiency ratings and the recommendation line. Everything else explains why those numbers are what they are. For a broader overview of where nutrients come from and how testing fits in, see essential nutrients for plants and gardens.
Reading the pH and lime requirement
The pH line is the first thing to read because it changes everything downstream. A pH below about 6.0 limits phosphorus, calcium, and magnesium availability; above about 7.5, iron, manganese, and zinc become scarce. The buffer pH is not your soil pH. It is a lab measurement of how much lime is needed to reach a target pH, and the report converts it into a lime recommendation in pounds per 1,000 square feet.
Apply lime only when the report calls for it, and only the amount it states. Lime is not fertilizer. It does not add nitrogen, phosphorus, or potassium. It changes the chemical environment so the nutrients already present become available. For the full mechanism of how pH controls nutrient uptake, read soil pH and nutrient availability.
The nutrient panel: ppm, lb/acre, and what “high” means
The nutrient panel lists each element with a concentration and a sufficiency rating. Concentrations appear in one of two units: parts per million (ppm) or pounds per acre (lb/acre). One ppm equals about 2 lb/acre in the top 6 inches of soil, so a reading of 25 ppm phosphorus is roughly 50 lb/acre. Labs that report lb/acre have already done that conversion for you.
Sufficiency bands are not universal. They depend on the extractant the lab uses (Mehlich 3, Bray, Olsen) and on the crop. A number that reads “high” for a lawn may read “medium” for a vegetable garden. Always read the band printed on your own report, not a chart copied from another lab. As a rough guide for home gardens:
| Nutrient | Typical sufficiency band (ppm) | What “High” means in practice |
|---|---|---|
| Phosphorus (P) | Low <15, Medium 15-30, High 30-50, Very High >50 | Skip phosphorus fertilizer; risk of runoff and wasted money |
| Potassium (K) | Low <75, Medium 75-150, High 150-250, Very High >250 | Skip potash; plants rarely respond |
| Calcium (Ca) | Low <500, Medium 500-1000, High >1000 | Usually fine; lime supplies it |
| Magnesium (Mg) | Low <50, Medium 50-100, High >100 | Usually fine; dolomitic lime supplies it |
Organic matter and CEC do not get a “low/medium/high” action line, but they explain your soil’s personality. Organic matter of 3 to 5 percent is solid for a garden; below 2 percent, expect to feed more often. CEC above 10 meq/100g means the soil holds nutrients well; sandy soils often sit at 3 to 6 and need smaller, more frequent applications.
Converting ppm to lb per 1,000 sq ft (worked example)
This is the number most gardeners never calculate, and it is the one that turns a report into a shopping list. The conversion assumes the standard 6-inch sampling depth used by most labs.
Formula: lb per 1,000 sq ft = ppm x 0.002 (for a 6-inch depth). Equivalently, ppm x 2 gives lb/acre, and one acre is 43,560 sq ft, so divide by 43.56 to get lb per 1,000 sq ft.
Worked example. Your report shows 40 ppm phosphorus and 120 ppm potassium on a 100 sq ft raised bed. Phosphorus: 40 x 0.002 = 0.08 lb P per 1,000 sq ft, which scales to 0.008 lb P on your 100 sq ft bed. Potassium: 120 x 0.002 = 0.24 lb K per 1,000 sq ft, or 0.024 lb K on the bed. Those are the actual nutrient masses in the soil you are about to plant into. Compare them to what a crop removes (a tomato crop might take up roughly 0.1 to 0.2 lb P per 1,000 sq ft over a season) and you see why “high” phosphorus rarely needs topping up.
If your report gives lb/acre, convert to lb per 1,000 sq ft by dividing by 43.56. If you need elemental phosphorus from a P2O5 figure, multiply P2O5 by 0.44; for potassium, multiply K2O by 0.83.
Worked example, continued. Imagine the same bed tests at 8 ppm phosphorus and 60 ppm potassium, both Medium. Phosphorus: 8 x 0.002 = 0.016 lb P per 1,000 sq ft, about 0.0016 lb on the bed. Potassium: 60 x 0.002 = 0.12 lb K per 1,000 sq ft, about 0.012 lb on the bed. A single season of tomatoes or peppers can remove a meaningful share of that, so a small phosphorus and potassium addition makes sense here. The recommendation line would likely show a modest P2O5 and K2O rate, and you would match it to a product with both nutrients. The contrast with the high-P example is the whole point: the same crop, different soil, different bag.
The recommendation line and how to use it
The recommendation line is the report’s answer to “what do I buy.” It states rates as N, P2O5, and K2O per 1,000 square feet or per acre, for the crop you listed. A typical line reads: “Apply 2 lb N, 0 lb P2O5, 1 lb K2O per 1,000 sq ft.” That is a shopping list in disguise.
Three points to get right:
- The units are N, P2O5, K2O. These are the same units on a fertilizer bag. No conversion needed before you shop. For why the label uses P2O5 and K2O instead of elemental P and K, see NPK ratio explained.
- The nitrogen rate is the driver. Labs size nitrogen to the crop and season. Phosphorus and potassium are sized to correct a deficiency, so they are often zero.
- Split applications. If the nitrogen rate exceeds about 1 lb per 1,000 sq ft, split it into two or three feedings rather than dumping it at once.
Turning that line into a bag weight is application-rate arithmetic, which has its own walkthrough at fertilizer application rate. The short version: divide the recommended nutrient rate by the nutrient percentage on the bag, then scale to your area.
When the report says “do not add” (high P or K)
This is the section that saves money and protects waterways. When phosphorus or potassium reads High or Very High, the recommendation line will show zero for that nutrient, sometimes with a note like “P is high; do not apply phosphorus.” Believe it. Adding phosphorus to soil that already holds plenty does not grow bigger tomatoes. It runs off into storm drains and feeds algae blooms.
The decision rule: if P is High or Very High, buy nitrogen-only. Look for a bag like 21-0-0, 32-0-0, or 46-0-0 (urea). If potassium is also high, a nitrogen-only product is still correct. If potassium is medium or low but phosphorus is high, a product like 21-0-10 or 32-0-10 supplies nitrogen and potassium without phosphorus. Match the recommendation line, not the habit of grabbing 10-10-10.
High phosphorus also changes your compost math. Compost adds phosphorus with every application, so a soil that is already high in P should get less compost, not more. For the tradeoff between compost and synthetic NPK, see NPK fertilizer vs compost.
One more caution. Some reports list a separate “available” phosphorus and “total” phosphorus. Only the available figure matters for fertilizing decisions. Total phosphorus includes forms locked in minerals that plants cannot use this season. If your report shows both, use the available column and ignore the total. The same distinction applies to potassium on a few lab formats.
From report to bag: choosing a product
Work the recommendation line left to right. Suppose the line reads “1.5 lb N, 0 lb P2O5, 0.5 lb K2O per 1,000 sq ft.” You need a product that supplies nitrogen and a little potassium, no phosphorus. A 32-0-10 product fits. The math: 1.5 lb N divided by 0.32 gives 4.7 lb of product per 1,000 sq ft for the nitrogen, which also delivers 4.7 x 0.10 = 0.47 lb K2O, close enough to the 0.5 lb target. If you want to dial potassium in exactly, blend or switch to a 21-0-21 at a slightly lower rate.
When the report calls for phosphorus, match it the same way: recommended P2O5 divided by the bag’s middle number. If no single bag matches, it is normal to apply two products, one for nitrogen and one for phosphorus or potassium, rather than forcing a 10-10-10 that over-applies what you do not need. For product format, price, and slow-release options, see fertilizer buying guide.
Timing matters as much as product. Nitrogen applied before a crop can use it leaches away. Match applications to growth stages using fertilizer schedule by plant type, and watch for signs of over-fertilization if you are guessing rather than following the report.
How often to retest
Retest every two to three years for a stable garden, and sooner if you change management: new beds, heavy compost use, or a shift from lawn to vegetables. Nitrogen is not reported on most standard tests because it changes week to week, so the nitrogen rate on your recommendation line is a crop-based estimate, not a measured value. Phosphorus and potassium move slowly, so a high reading today will likely still be high next season. That stability is exactly why “do not add phosphorus” stays good advice for several years.
Pull samples from the top 6 inches, take 8 to 12 cores across the area, mix them in a clean bucket, and send about a cup. Sample when soil is moist but not wet, and avoid fertilizing or liming for at least six weeks before sampling so the report reflects baseline conditions.
If results come back wildly different from what you expected, resample before acting. A single core taken near a compost pile or a recent spill can skew the whole report. Labs average what you send, so the sample has to represent the area, not one spot.
Last updated: October 28, 2026.
Sources
- Penn State Extension, “Interpreting Soil Test Results,” extension.psu.edu.
- University of Missouri Extension, G9077, “Soil Testing for Lawns and Gardens,” extension.missouri.edu.
- Colorado State University Extension, “Soil Testing,” extension.colostate.edu.
- UF/IFAS Extension, SS763, “Soil Testing and Interpretation for Florida,” edis.ifas.ufl.edu.
- University of Minnesota Extension, “Soil Test Interpretations and Fertilizer Management,” extension.umn.edu.
- NCDA and CS Agronomic Division, “Understanding Your Soil Test Report,” ncagr.gov.
- Michigan State University Extension, “Soil Testing for Home Gardens,” canr.msu.edu.
The actual number is the decision.
From Bank Statement to QuickBooks-Ready File
That manual cleanup you just read about? This tool skips it. Turn your PDF into QBO for QuickBooks without storing your data anywhere.
Start Converting